Titles, Labels, Text
Note: This section refers to graphs obtained via the plot() command.
Graphs typically have labels; you may also wish to add titles or subtitles. You may also wish to tamper with the axis and the tick labels, or you may add text. Finally, mathematical elements deserve special attention.
Annotating a graph
Most graphs will automatically have axis labels, but no title or subtitle. Also, you may wish to change the labels.
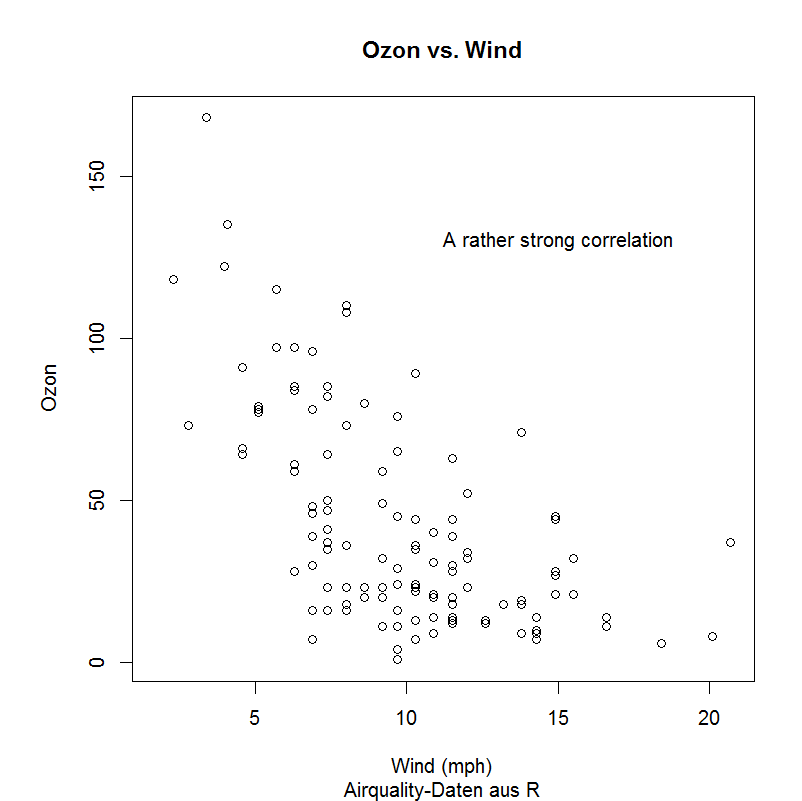
The example graph on the left (see below), using R's "air quality" data (attach(airquality)), was produced by the following command that uses a strange mix of German and English, just for demonstration purposes.
plot(Wind,Ozone, main="Ozon vs. Wind", ylab="Ozon",
xlab="Wind (mph)", sub="Airquality-Daten aus R",
text(15,130, "A rather strong correlation"))
Most of the command should be self-explaining, but the last line deserves commenting. The numbers "15" and "130" refer to the values of the x and the y axis, respectively, at which the text is to be placed.
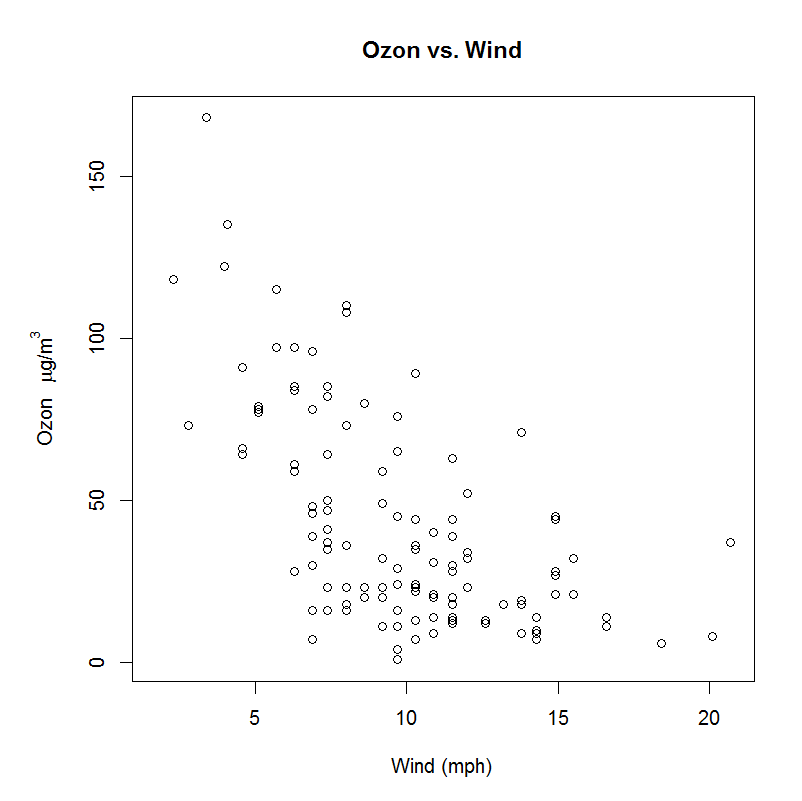
The graph on the right hand side demonstrates the use of mathematical elements. Of course such elements may be used everywhere, not just in the labels. Two things are noteworthy: First, because a greek letter plus a superscript are to be used, the keyword "expression" has to be deployed; and the elements of this expression are to be combined via "paste", with non-mathematical elements in double quotes. Second, as the superscript increases the height of the y axis label, the left margin has to be increased (see entry on parameters) in order to create the necessary space.
par(mai = c(1, 1.1, 0.8, 0.4))
plot(Wind,Ozone, main="Ozon vs. Wind", xlab="Wind (mph)",
ylab=expression(paste("Ozon " , mu, "g","/", m^3)))
More on mathematical elements
In the previous section, a greek letter (common in math) and a superscript indicating the cube were used. Many other mathematical elements are available. Please have a look at the R help system via ?plotmath
© W. Ludwig-Mayerhofer, R Guide | Last update: 03 Apr 2017